
The world’s supply chains and procurement operations are under more scrutiny than ever, and companies are tasked with improving resilience, boosting efficiency, and meeting the delivery expectations of customers. Disruptions from the COVID-19 pandemic, postal worker and dock strikes, geopolitical strife, and natural disasters have increased the need for companies to focus on resilience, supply chain efficiency, and building relationships. These aspects of their operations will be critical to supply chain operations. Here are some tools that can help identify and resolve underlying issues, all of which are available for free for subscribers to my monthly newsletter.
Don’t wait for the next disruption. Download your copy now and get ahead of the curve with a proven framework for future-ready, antifragile supply chains.
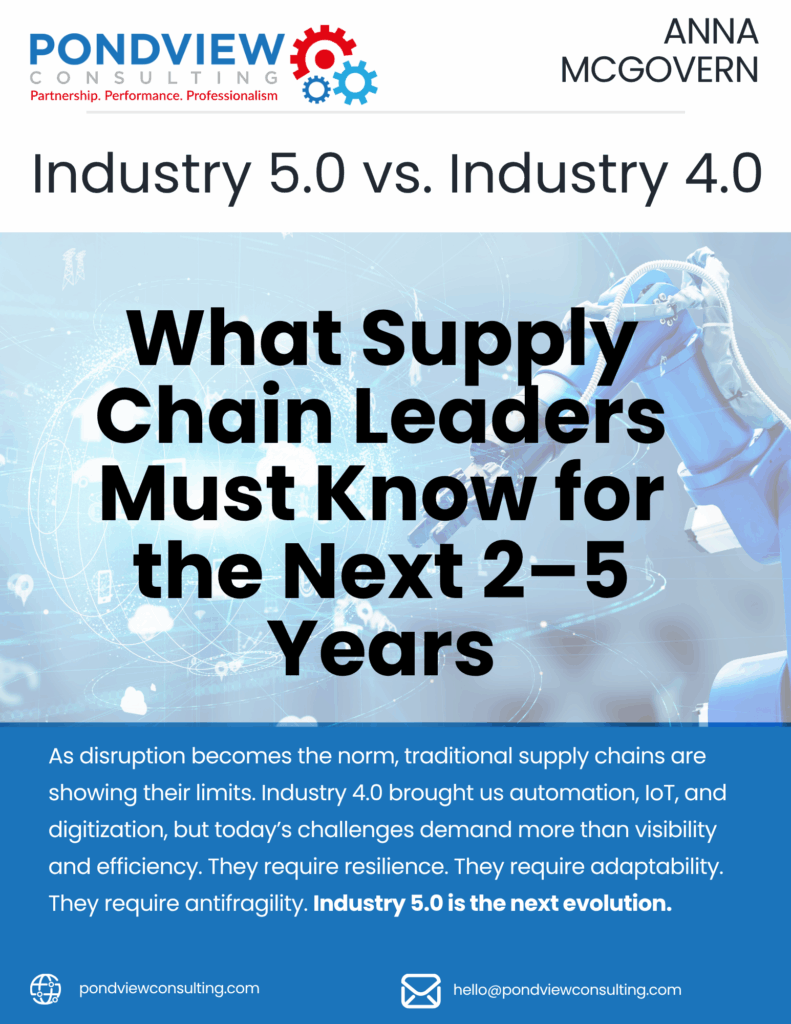
Is Your Supply Chain Ready for Industry 5.0?
Discover how to build antifragile supply chains in a world defined by disruption, sustainability demands, and rapid technological change.
Industry 4.0 brought automation and visibility but it also exposed just how brittle global supply chains can be. As volatility increases, resilience alone isn’t enough. It’s time to design supply chains that don’t just survive disruption—they grow stronger because of it.
This free white paper explores how Industry 5.0 is transforming operations by putting people, purpose, and planet at the center of innovation. Learn what’s next, what it means for supply chain leaders, and how to take action now.
What You’ll Learn
- The core differences between Industry 4.0 and Industry 5.0
- Why antifragility is the new benchmark for operational excellence
- How cobots, circularity, and GenAI are reshaping the supply chain landscape
- The 5 biggest shifts happening between now and 2030—and how to prepare
- A roadmap to begin your Industry 5.0 transition
Who Should Read This
- Supply chain executives and operations leaders
- CIOs, CTOs, and transformation officers
- Manufacturing, procurement, and logistics professionals
- Sustainability and ESG program leaders
IBP Fast Track Toolkit + Cost Calculator
Why do some companies keep struggling with S&OP, working capital, and forecasting while others excel? Integrated Business Planning (IBP) is the difference between agility and chaos. Yet, too many CPG and manufacturing companies still operate in silos, leading to:
❌ S&OP misalignment – Sales overcommits, supply chain can’t deliver, finance is blindsided.
❌ Working capital nightmares – Excess inventory, cash tied up, stockouts.
❌ Forecasting errors – Data disconnects, reactive planning, margin erosion.
Integrated Business Planning (IBP) is the glue that connects strategy with execution across supply chain, finance, sales, and operations. Yet too many companies still operate in solos, leading to S&OP chaos working capital drains, and forecasting disasters.
Download my IBP Fast Track Toolkit and Cost Calculator.
Is Your Supply Chain Built for the Future?
The most successful companies aren’t just resilient; they’re antifragile. Learn how to future-proof your supply chain by downloading a FREE copy of “The Supply Chain Antifragility Playbook: 5 Strategies to Turn Disruption into Growth”:
💡 Don’t just survive supply chain disruptions—thrive because of them.
✅ Develop supplier flexibility
✅ Use AI for predictive forecasting
✅ Build stronger relationships
Sign up for the Pondview Consulting monthly newsletter below, and you will receive a free copy of The Supply Chain Antifragility Playbook: 5 Strategies to Turn Disruption into Growth.
This free resource contains powerful strategies to turn volatility into competitive advantage.
✅ Build diversity into your supply chain
✅ Strengthen supplier relationships
✅ The power of AI-driven predictive insights
✅ Optimize inventory management
✅ Enhance supply chain visibility
💡 Proven frameworks from top companies like Toyota, Walmart & Unilever
Or, get in touch with me to request a copy by emailing hello@pondviewconsulting.com or connecting with me on LinkedIn.
Corporate Sustainability Reporting Directive
The Corporate Sustainability Reporting Directive (CSRD) is a key regulatory development in the European Union, designed to
increase transparency and accountability for businesses regarding environmental, social, and governance (ESG) matters.
This report serves as a practical guide for companies to understand the CSRD’s requirements, including who it applies to, the scope of reporting obligations, and the timeline for implementation.
With specific insights for industries such as plastics and paper, this guide outlines how businesses can prepare for compliance,
engage with their supply chains, and turn sustainability
reporting into a strategic advantage.
Through proactive preparation, companies can meet regulatory demands and also unlock opportunities for long-term value creation.
Sign up for the Pondview Consulting monthly newsletter below, and you will receive a free copy of my white paper, Corporate Sustainability Reporting Directive: A Comprehensive Guide to Best Practices.
Or, get in touch with me to request a copy by emailing hello@pondviewconsulting.com or connecting with me on LinkedIn.
How Will AI Impact Your Supply Chain Strategy?
Technology – specifically AI – is changing the supply chain game. In this white paper, I look at how AI is transforming both the supply chain and the role of supply chain leaders. I explore:
The leadership shift AI is causing and the actions leaders are taking now to leverage AI for supply chain excellence.
The impact of AI and the potential power it has to improve supply chain management.
The radical impact AI will have on labor and team dynamics.
How leaders can implement AI effectively.
A case study that looks into how Walmart embraced AI and used the technology to compete effectively with Amazon.
and so much more!
Sign up for the Pondview Consulting monthly newsletter below, and you will receive a free copy of my white paper, Revolutionizing Supply Chain Excellence through the Integration of AI and Machine Learning.
Or, get in touch with me to request a copy by emailing hello@pondviewconsulting.com or connecting with me on LinkedIn.
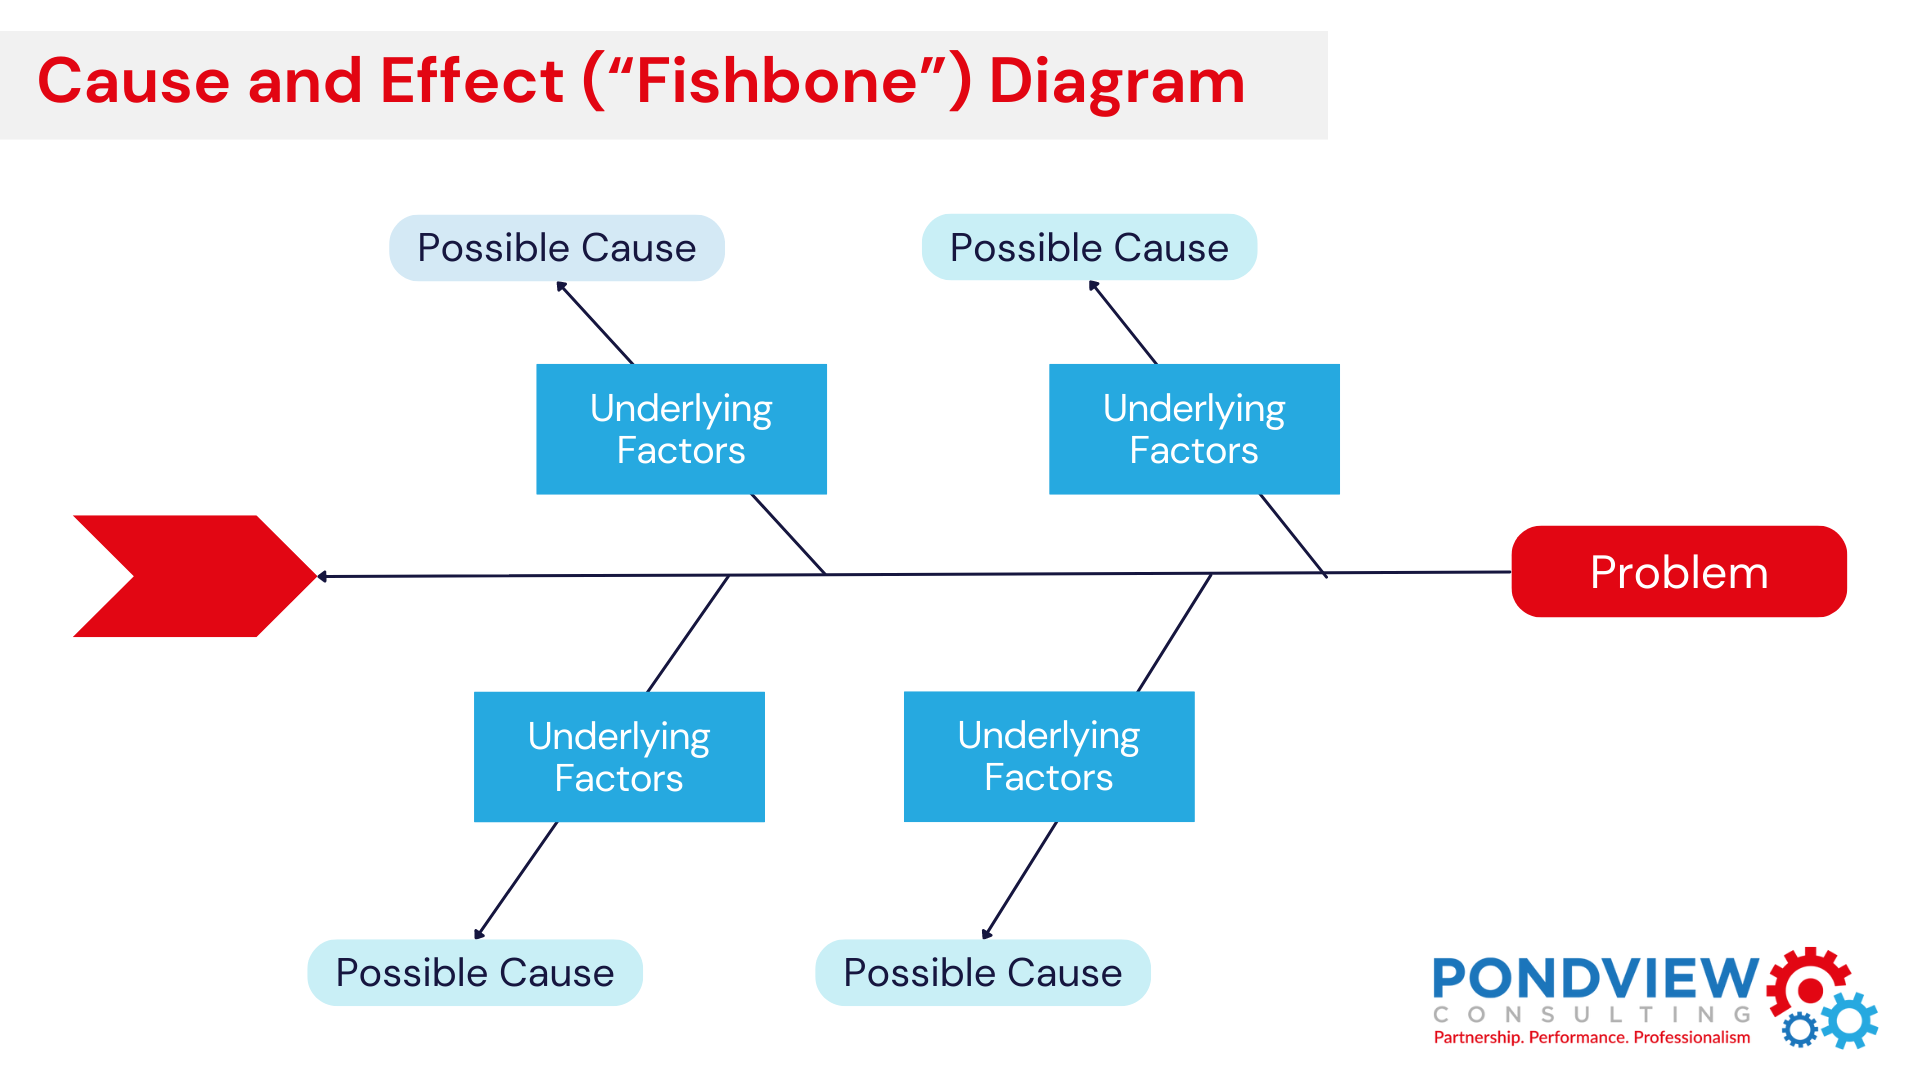
Cause & Effect "Fishbone" Diagram
Fishbone Diagram, also known as a Cause and Effect Diagram or an Ishikawa Diagram after its creator, is a brainstorming tool. It is designed to assist with identifying potential root causes for an undesirable effect.
Causes are often grouped into the following categories:
- Man/Mind Power (People)
- Method (Process)
- Machines (Program)
- Materials (Product)
- Measurements (Policy)
- Milieu/Mother Nature (Place)
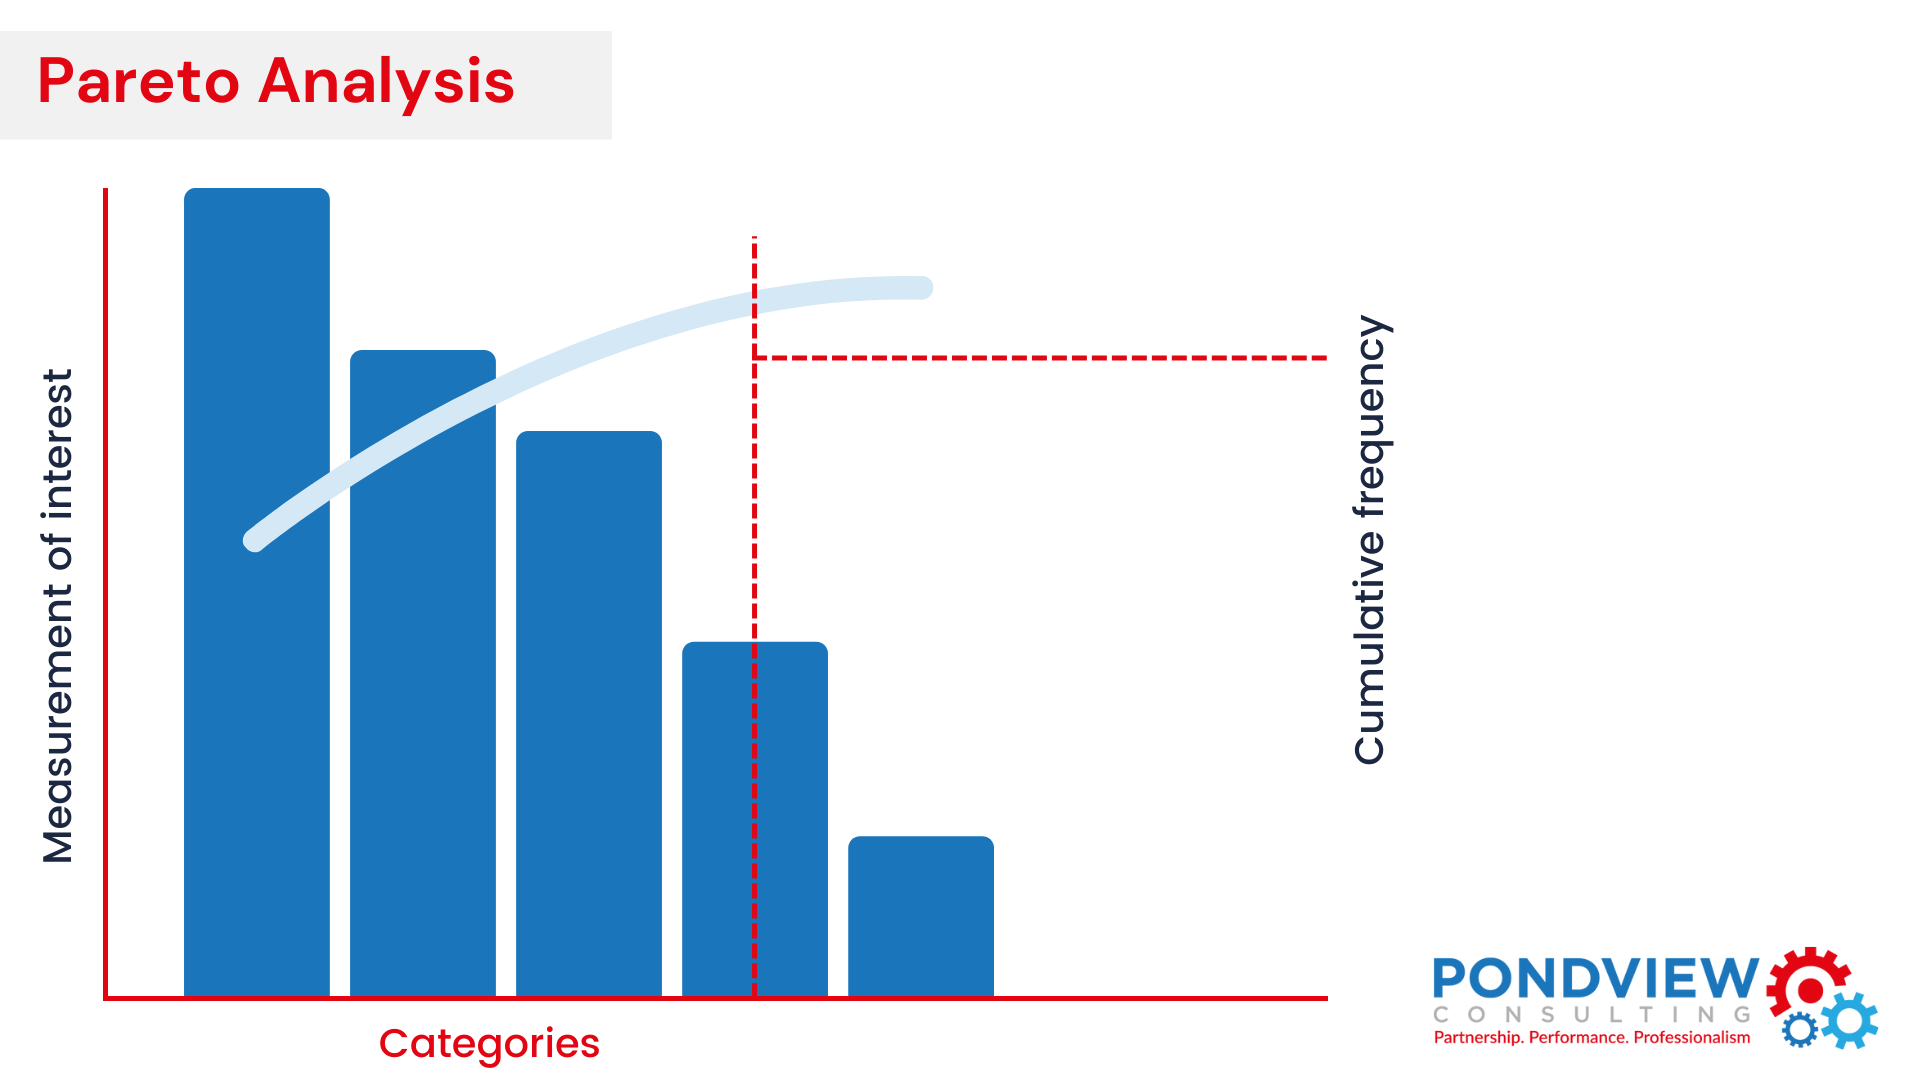
Pareto Analysis
A Pareto chart is a cause analysis tool in the form of a bar graph that visually depicts which situations are more significant. The lengths of the bars represent frequency or cost, time or money.